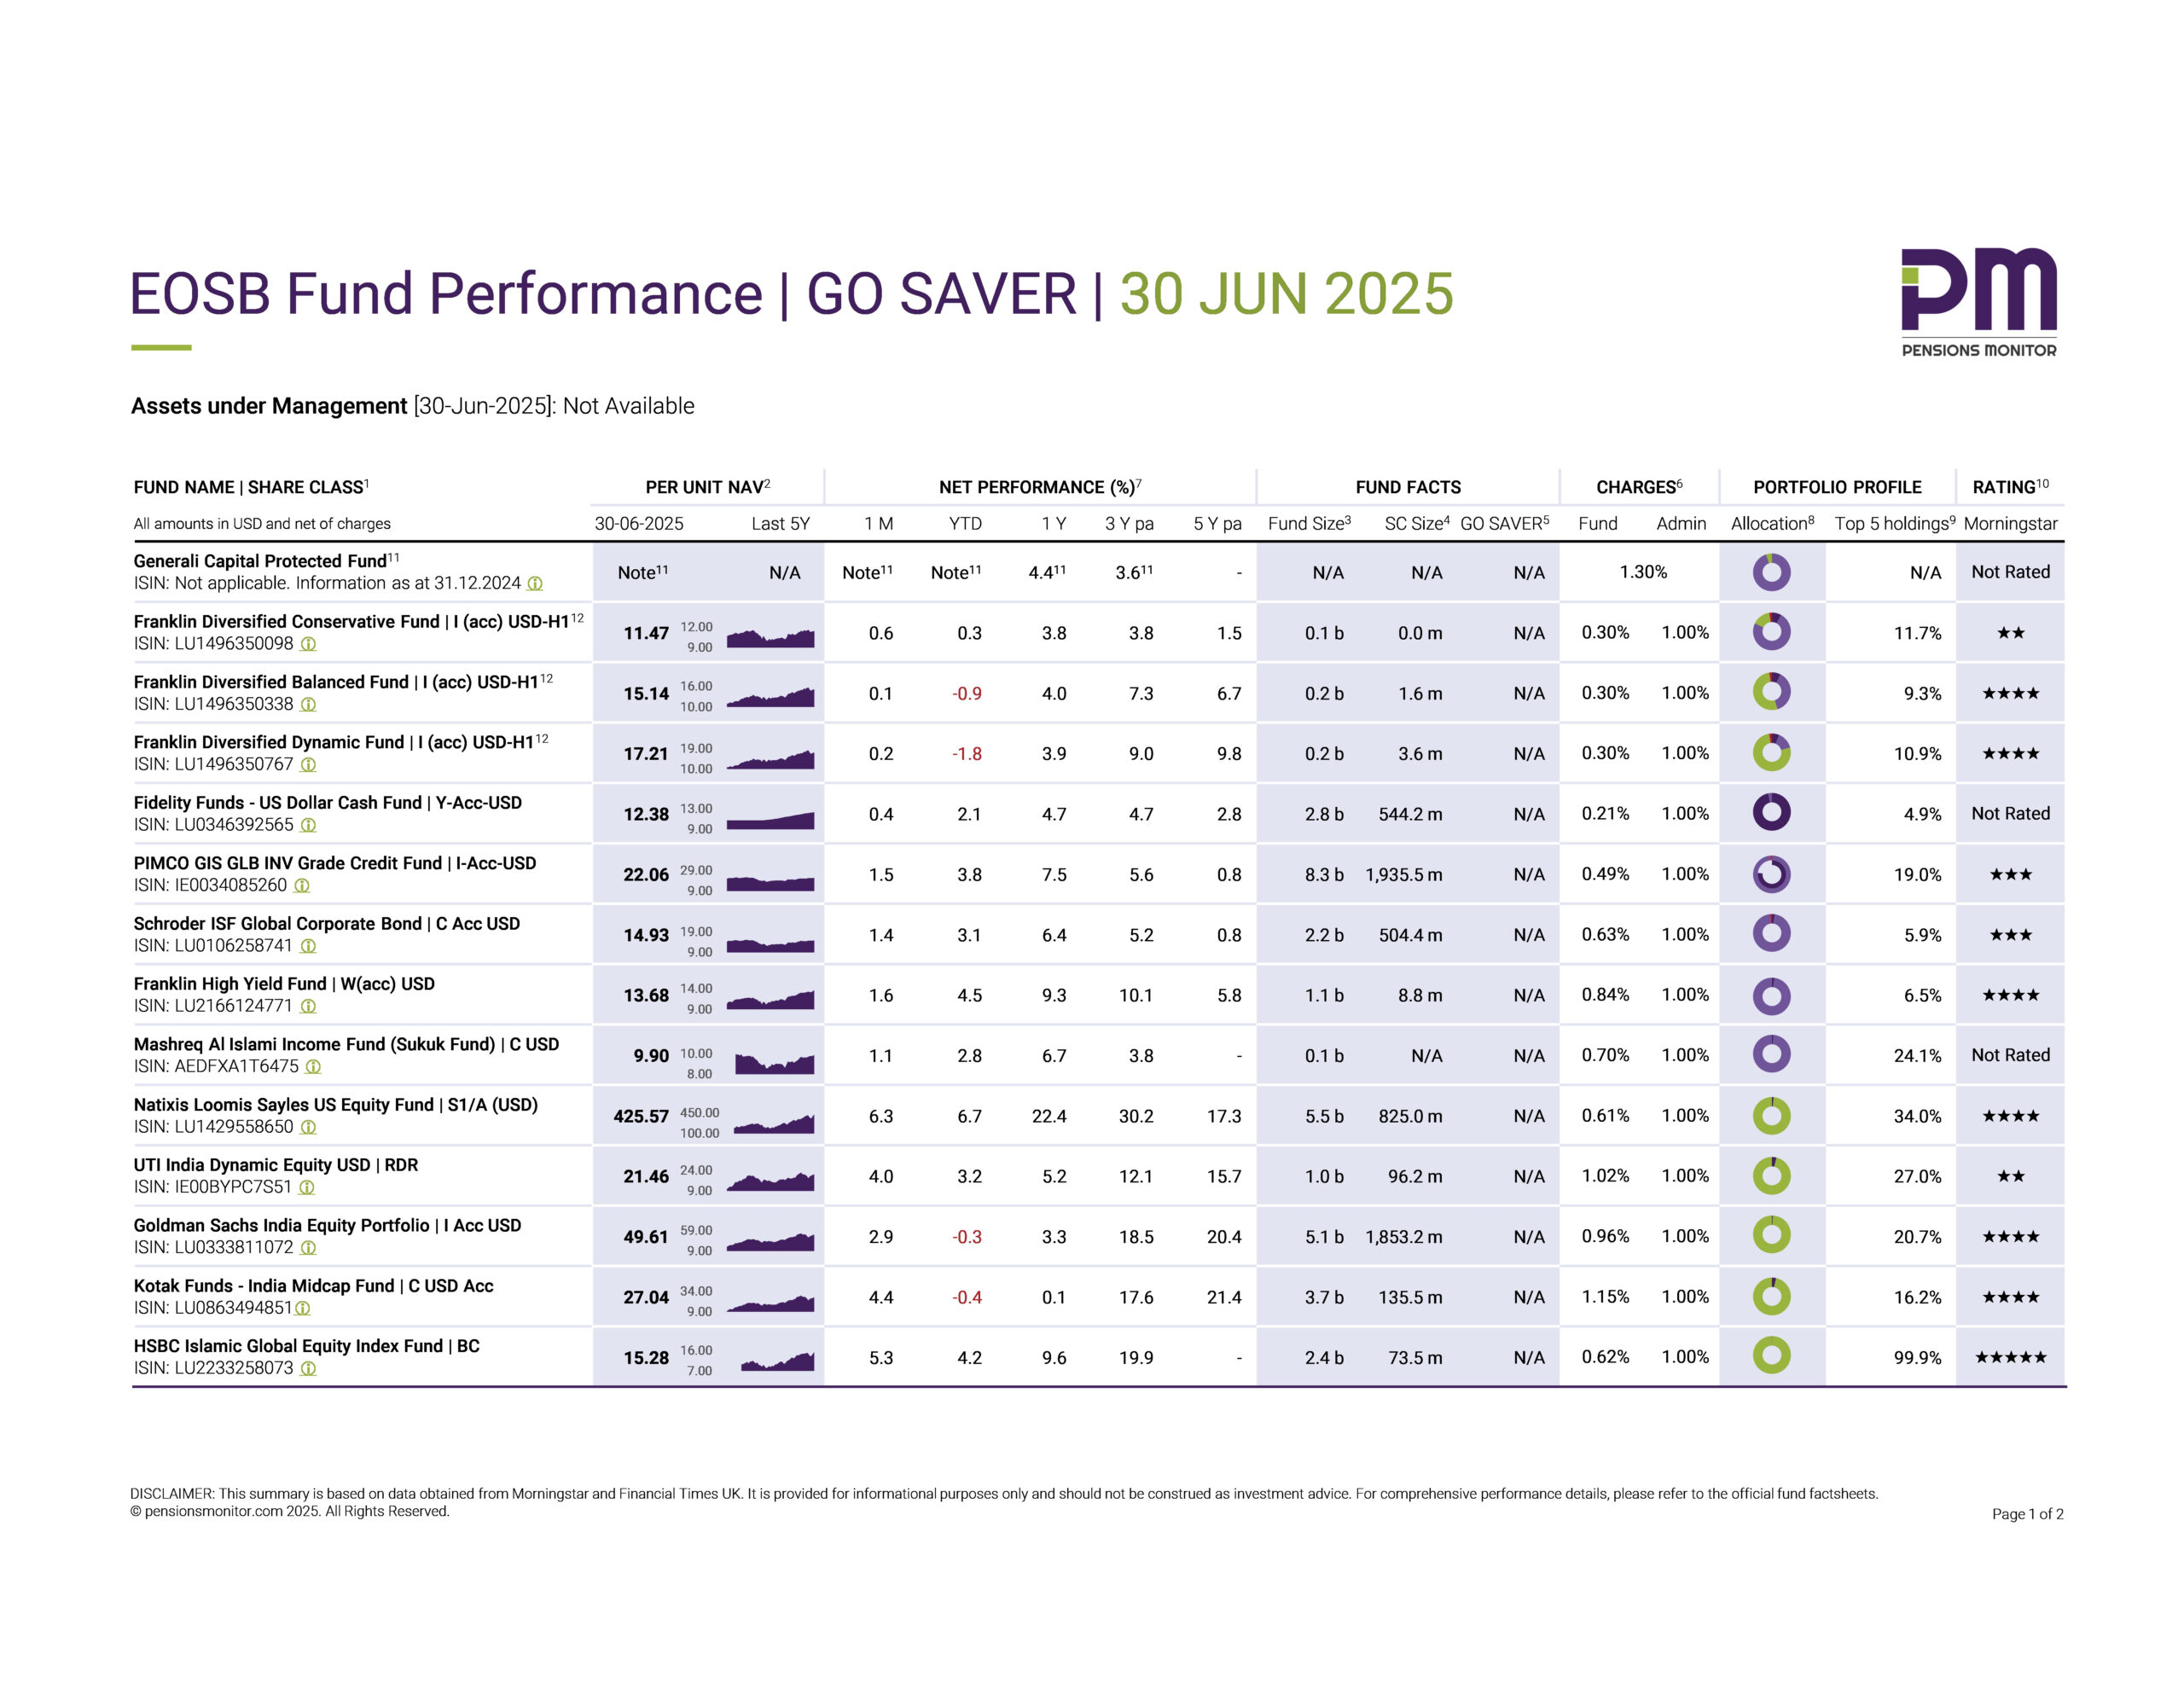
EOSB Fund Performance | GO SAVER | 30 JUN 2025
Following our recent post on DEWS’ mid-year results, it’s now time to take stock of fund performance under the GO SAVER Plan, the other official DIFC End-of-Service Benefits (EOSB) Savings Plan, operated by Sukoon Insurance.
👉 Click here to download the dashboard.
Note: Please be reminded that the GO SAVER fund performance presented in the dashboard is net of fund management fees, but does not include the plan operator fee of 1.0% per year. For a fair comparison with DEWS (which reports returns after all fees), an additional operator fee should be deducted from GO SAVER’s returns, based on the period being reviewed. For example, for a 6-month return, subtract 0.5% to account for half the annual operator fee.
Fund performance YTD 30 June 2025
Broadly speaking, the trends seen in GO SAVER’s fund performance last month have largely continued in June 2025. Here’s a breakdown by category:
Bond-based funds have delivered stable and positive Year-to-Date (YTD) returns:
- the Franklin High Yield Fund: +4.5%;
- the PIMCO Inv Grade Credit Fund: +3.8%
- the Schroder ISF Global Corporate Bond: +3.1%
- the Mashreq Al Islami Income Fund (Sukuk Fund): +2.8%
These results are mostly consistent with global bond market dynamics, where easing inflation and expectations of rate adjustments have supported fixed income assets.
Equity-based funds:
US focused: The Natixis Loomis Sayles US Equity Fund, GO SAVER’s only pure-play US equity fund, has performed strongly with YTD returns of +6.7%. This is an actively managed fund with a long-term approach that invests in businesses as partners rather than simply trading stocks. The fund invests primarily in equity securities of larger U.S. companies such as Nvidia, Meta Platforms, Tesla, Amazon, Netflix, Alphabet, Boeing, Oracle, Microsoft, Visa that together make up ~60% of the total assets of the fund. Some of these underlying assets have seen strong growth in H1 2025.
India focused: The Indian market funds which we discussed in detail previously, are showing signs of recovery, however, the YTD results remain relatively muted:
- UTI India Dynamic Equity Fund: +3.2%
- Goldman Sachs India Equity Portfolio: –0.3%
- Kotak India Midcap Fund: –0.4%
Balanced funds: Performance across the three Franklin Diversified range has been relatively subdued so far this year, with weaker results at the higher-risk end:
- Conservative Fund: +0.3%
- Balanced Fund: –0.9%
- Dynamic Fund: –1.8%
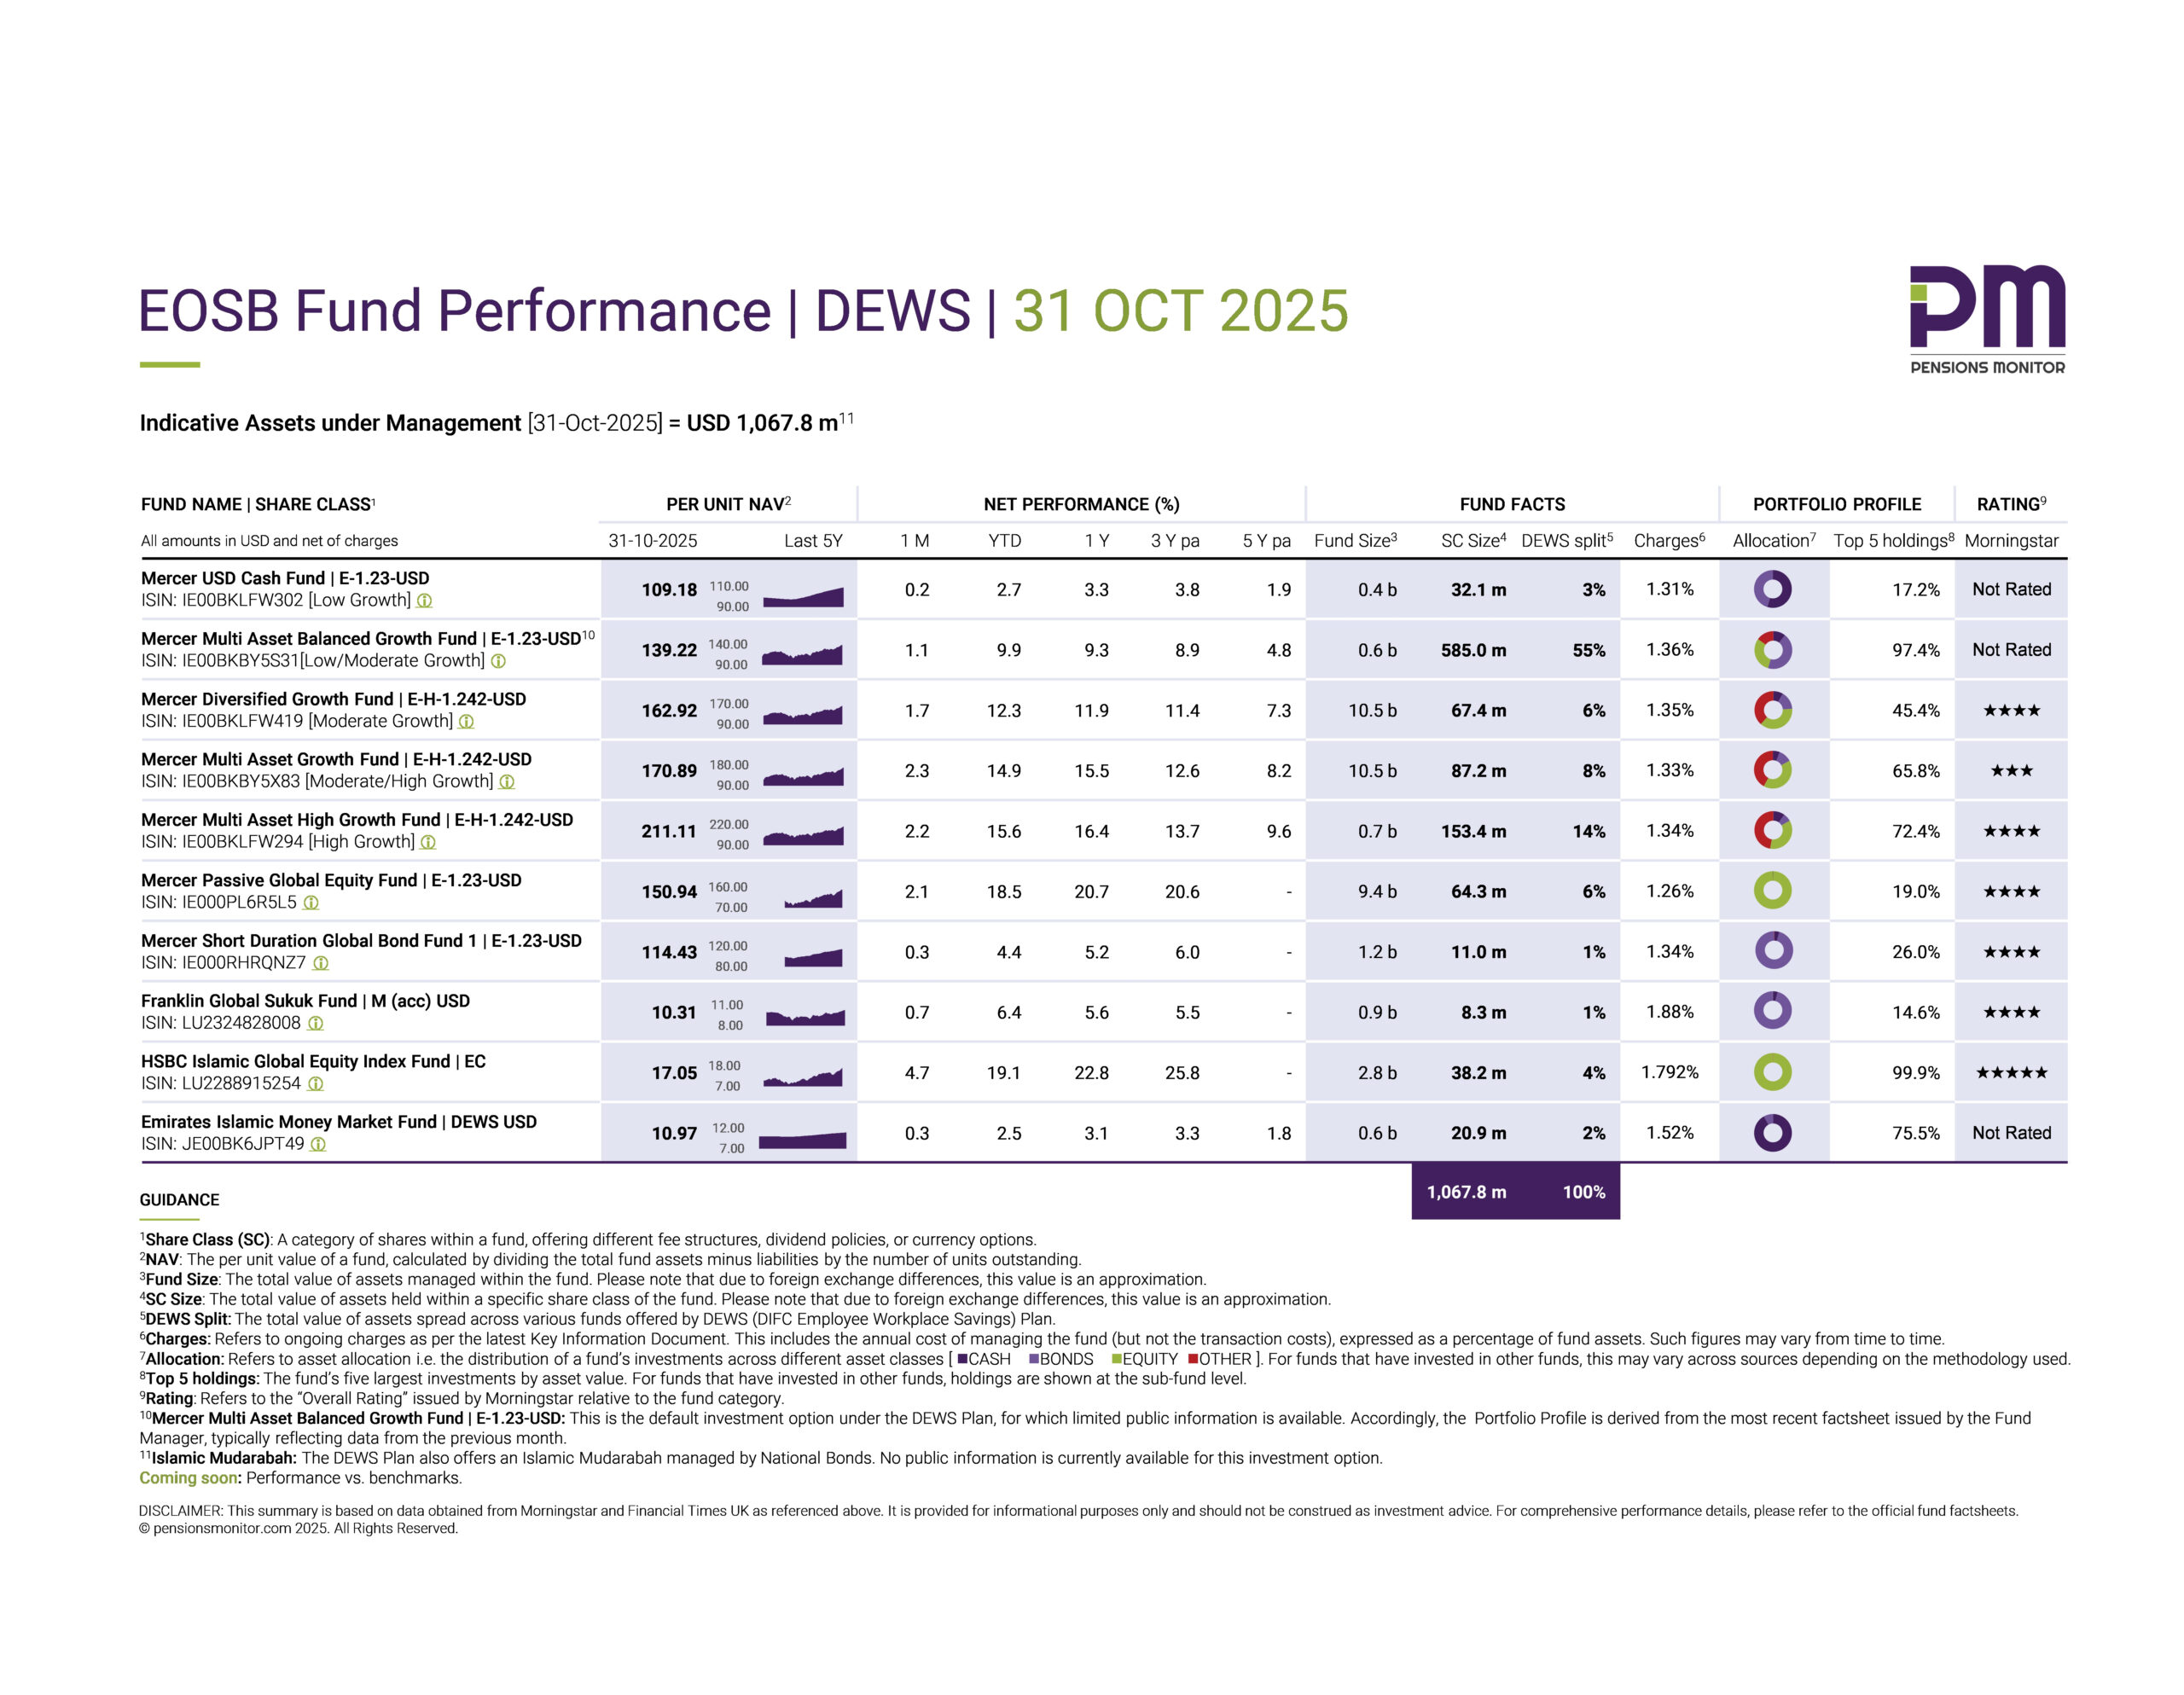
The default fund: Many of our readers are eager for insights on GO SAVER’s default option, the Generali Capital Protected Fund. This month, there’s more information to share but first, it’s important to understand a few fundamentals.
This is not a traditional mutual fund with a public ISIN or daily-traded NAV (Net Asset Value per share/unit). Instead, it’s part of “Generali’s USD General Account” – an insurance-based investment vehicle. It is designed specifically for long-term pension and savings liabilities, and aims to provide the said protection of both, capital and returns that accumulate over time.
So unlike a typical traded mutual fund, this fund is accounted for on a book value basis and does not mark its assets to market. Its returns depend on the book yield of the fixed income elements, and the realised gains or losses from other asset classes. Hence, such funds typically report performance annually.
Based on the latest Product Information Document received this month, the USD General Account was launched in 2022 and has generated annual gross returns as below.
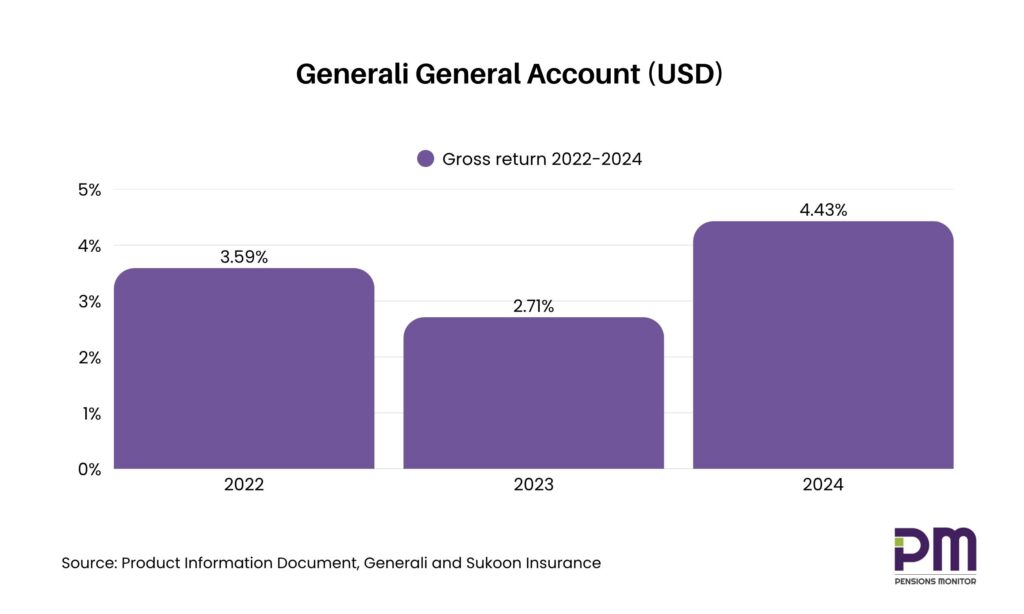
This averages 3.6% gross over three years. With annual fees of 1.3%, the 3Y net return averages to 2.3% per year with the added benefit of capital protection.
As of now, no performance data has been shared for H1 2025, so there’s no insight on how the fund has fared this year. That said, the underlying portfolio is made up of US Treasury Bonds (60–85%), Corporate Bonds (20–25%) rated AA to B, and a small allocation to North American Equities (0–10%), all of which are measurable asset classes.
This raises the hope that performance reporting will become more regular and publicly accessible over time, especially since the default option is where all EOSB contributions are automatically invested (unless employees actively choose another option), making transparency even more important.
Final thoughts
It has been a very dynamic and, at times, volatile first half of the year across global financial markets. Within that context, and within the constraints of the respective fund mandates, the GO SAVER fund range has delivered generally category-consistent performance – particularly in fixed income and US equities.
But equally important is to track the current performance of the default fund. Let’s hope to report more current figures for H1 2025 in the next dashboard.
A category-wise comparison between the GO SAVER and DEWS fund ranges is also planned for the coming months, that should be of interest to our readership.
If you found this article useful, or have questions or comments, do write to us: info@pensionsmonitor.com.
Please also sign up to our free newsletter to stay up to date on all matters relating to end of service savings schemes!
Disclosure Statement

Issued in accordance with the UAE Securities and Commodities Authority’s Finfluencer Regulation.
Article: EOSB Fund Performance | GO SAVER | 30 Jun 2025
Author: Nisha Braganza
Capacity: Natural person
SCA Finfluencer Registration: 012
Data sources: Morningstar, Financial Times UK and factsheets, cited in the Article
Data date: 30 Jun 2025
Price time reference: NAVs used reflect end-of-day pricing as of “Data date”
Publication date: 22 Jul 2025
Target audience: Employers/employees tracking EOSB Savings Schemes in the UAE
Validity: 30-day period from "Data date", unless updated

Nature of content
The Article contains a dashboard (factual data and performance data) and accompanying commentary.
Factual data includes Net Asset Value (NAV) per share, fund size, share class size, asset allocation, charges, top holdings, and ratings. These are sourced from “Data sources” and has not been modified.
Performance data is calculated using a proprietary time-weighted return model, based on daily NAV movements. The model does not involve forward-looking assumptions or forecasts.
Commentary is the author’s opinions and interpretations of the data and does not constitute financial advice or a recommendation to buy, sell, or invest in any fund. Comparisons between funds are based on publicly available information. These do not represent endorsements and have been drafted impartially, without bias or exaggeration.

Limitations
While reasonable care has been taken to ensure objectivity, balance, and clarity, the Author has relied on “Data sources” without independent verification. Accordingly, the Author does not accept responsibility for the accuracy or completeness of “Data sources”. Past performance is not indicative of future results and commentary does not represent expected outcomes. Previous Articles on the subject are available on www.pensionsmonitor.com.

Conflicts of interest
The Author has not received any compensation from the respective fund issuers, nor holds investments in any of the funds mentioned. No party involved in this publication has a commercial relationship with the respective fund issuers or EOSB Scheme managers.

Investment advice disclaimer
Investors are advised to consult with a financial advisor licensed by the UAE Securities and Commodities Authority or other relevant authority, before making investment decisions.